Ronchigrams
Scott Prahl
Dec 2025
[1]:
%config InlineBackend.figure_format = 'retina'

import sys
import matplotlib.pyplot as plt

if sys.platform == "emscripten":
    import piplite

    await piplite.install("lenstest")

import lenstest
Introduction
Ronchigrams are often used in the field of optics to test the quality of mirrors and other optical elements. They can also be used to determine the curvature of a mirror.
To create a ronchigram, you will need the following materials:
A Ronchi grating, characterized by a series of opaque lines with same with as interline spacing
A point source of light source.
A screen or surface to project the ronchigram onto.
A lens or mirror that is the device under test.
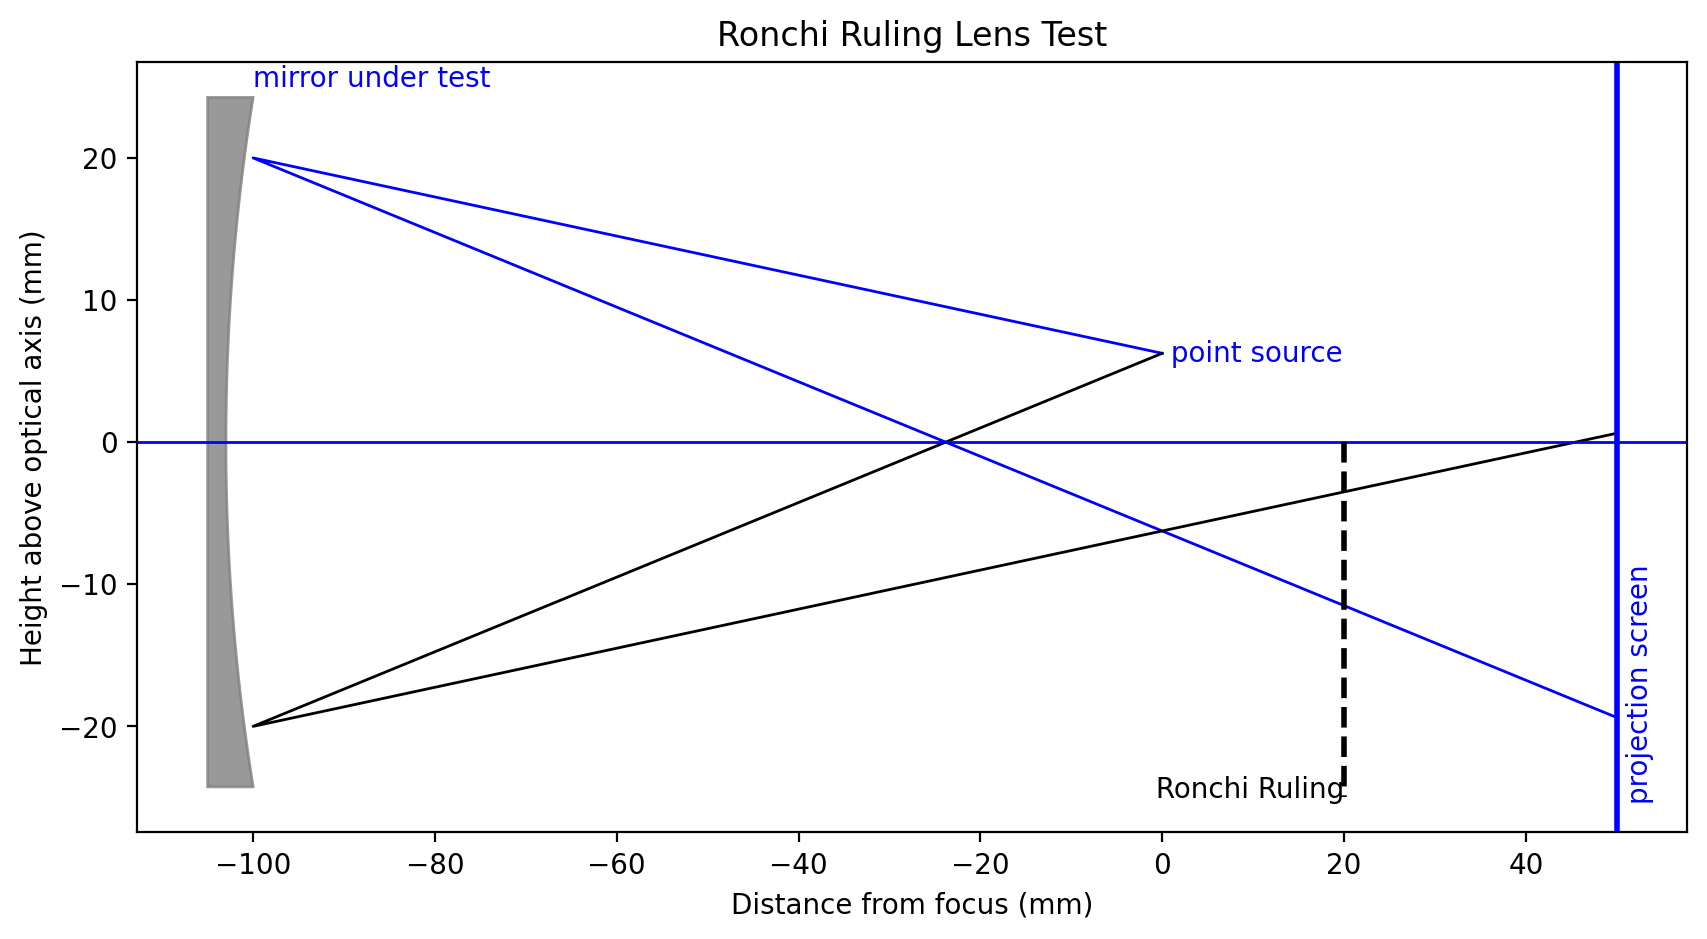
If a mirror is being tested then the Ronchi ruling may be placed before or after the focus. When the ruling is after the focus then the layout looks like this
[2]:
D = 50
RoC = 100
z_offset = 20
lenstest.ronchi.plot_mirror_layout(D, RoC, z_offset)
plt.show()
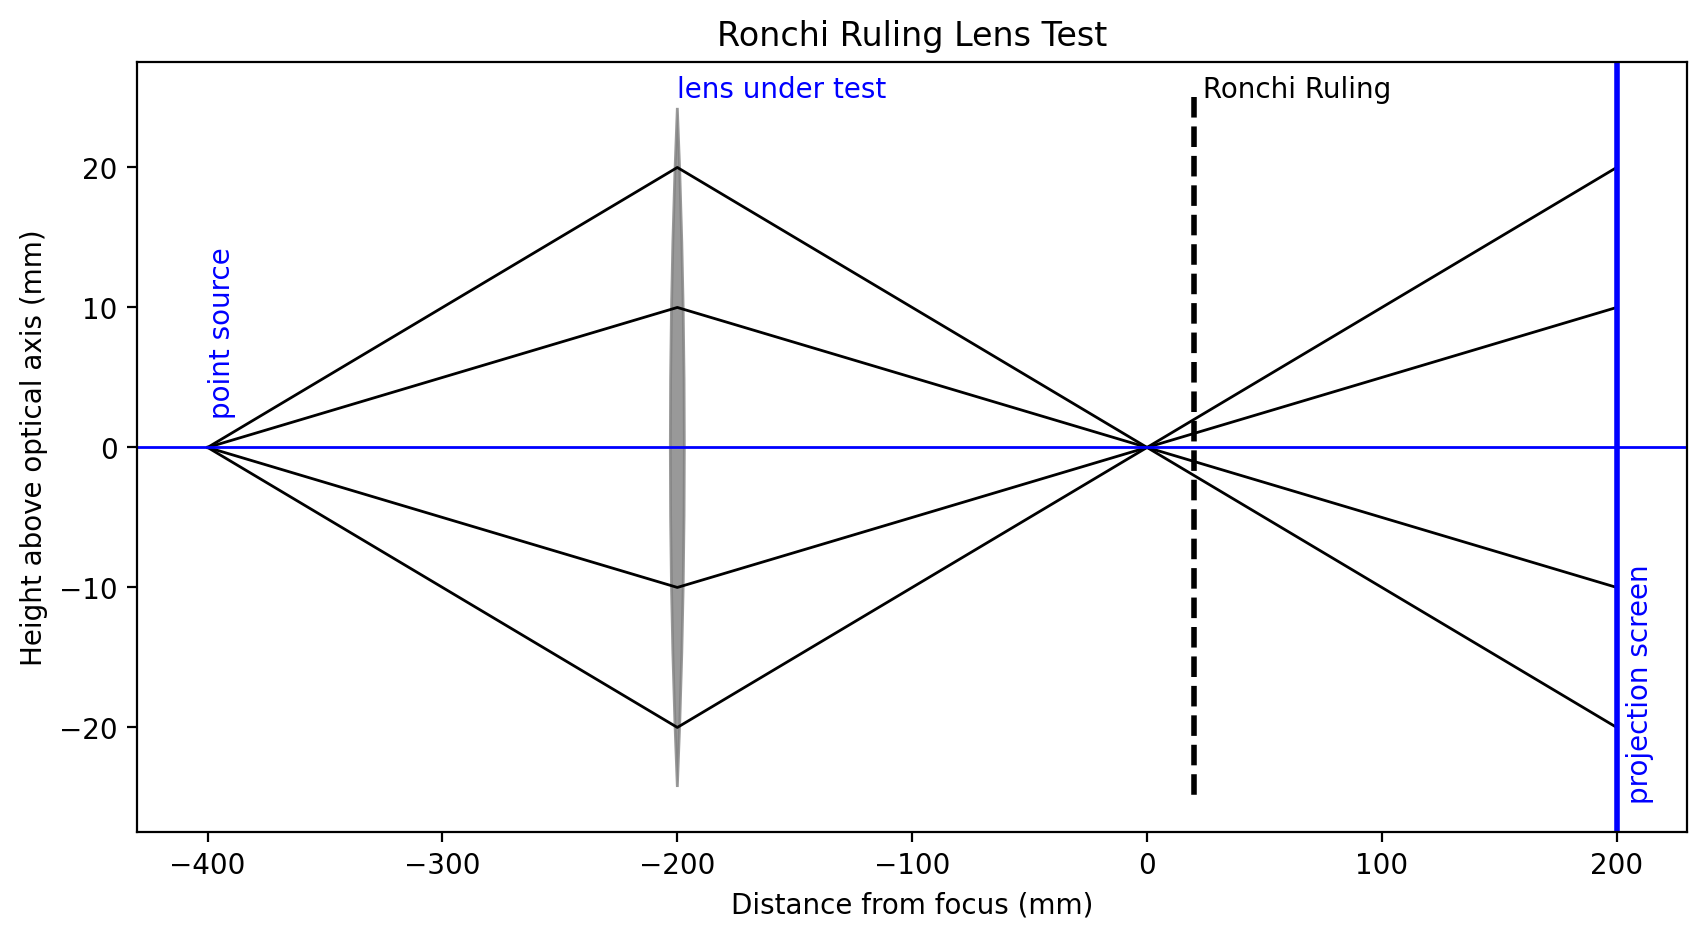
If a lens is being tested, then the layout is a 4f system. Note that the code treats the lens with focal length f as identical to a f=RoC/2 mirror.
[3]:
D = 50
RoC = 100
z_offset = 20
lenstest.ronchi.plot_lens_layout(D, RoC, z_offset)
plt.show()
10 inch parabolic mirror comparison
[4]:
conic = -1  # parabolic
D = 10 * 25.4  # mirror diameter [mm]
z_offset = -0.62 * 25.4  # Ronchi location relative to focus [mm}
RoC = 160 * 25.4  # mm
lines_per_in = 100  # grating freq: (clear + opaque) lines/inch
lp_per_mm = (lines_per_in / 2) / 25.4  # line pairs per mm

print("         Mirror Diameter = %.3f inches" % (D / 25.4))
print("            Focal Length = %.3f inches" % (RoC / 25.4 / 2))
print("                F number = %.3f" % (RoC / 2 / D))
print("     Radius of curvature = %.3f inches" % (RoC / 25.4))
print("Ronchi grating frequency = %.3f line pairs / inch" % (lp_per_mm * 25.4))
print("         Ronchi position = %.3f inches after focus" % (z_offset / 25.4))
lenstest.ronchi.plot_ruling_and_screen(D, RoC, lp_per_mm, z_offset, conic=conic)
plt.show()
         Mirror Diameter = 10.000 inches
            Focal Length = 80.000 inches
                F number = 8.000
     Radius of curvature = 160.000 inches
Ronchi grating frequency = 50.000 line pairs / inch
         Ronchi position = -0.620 inches after focus
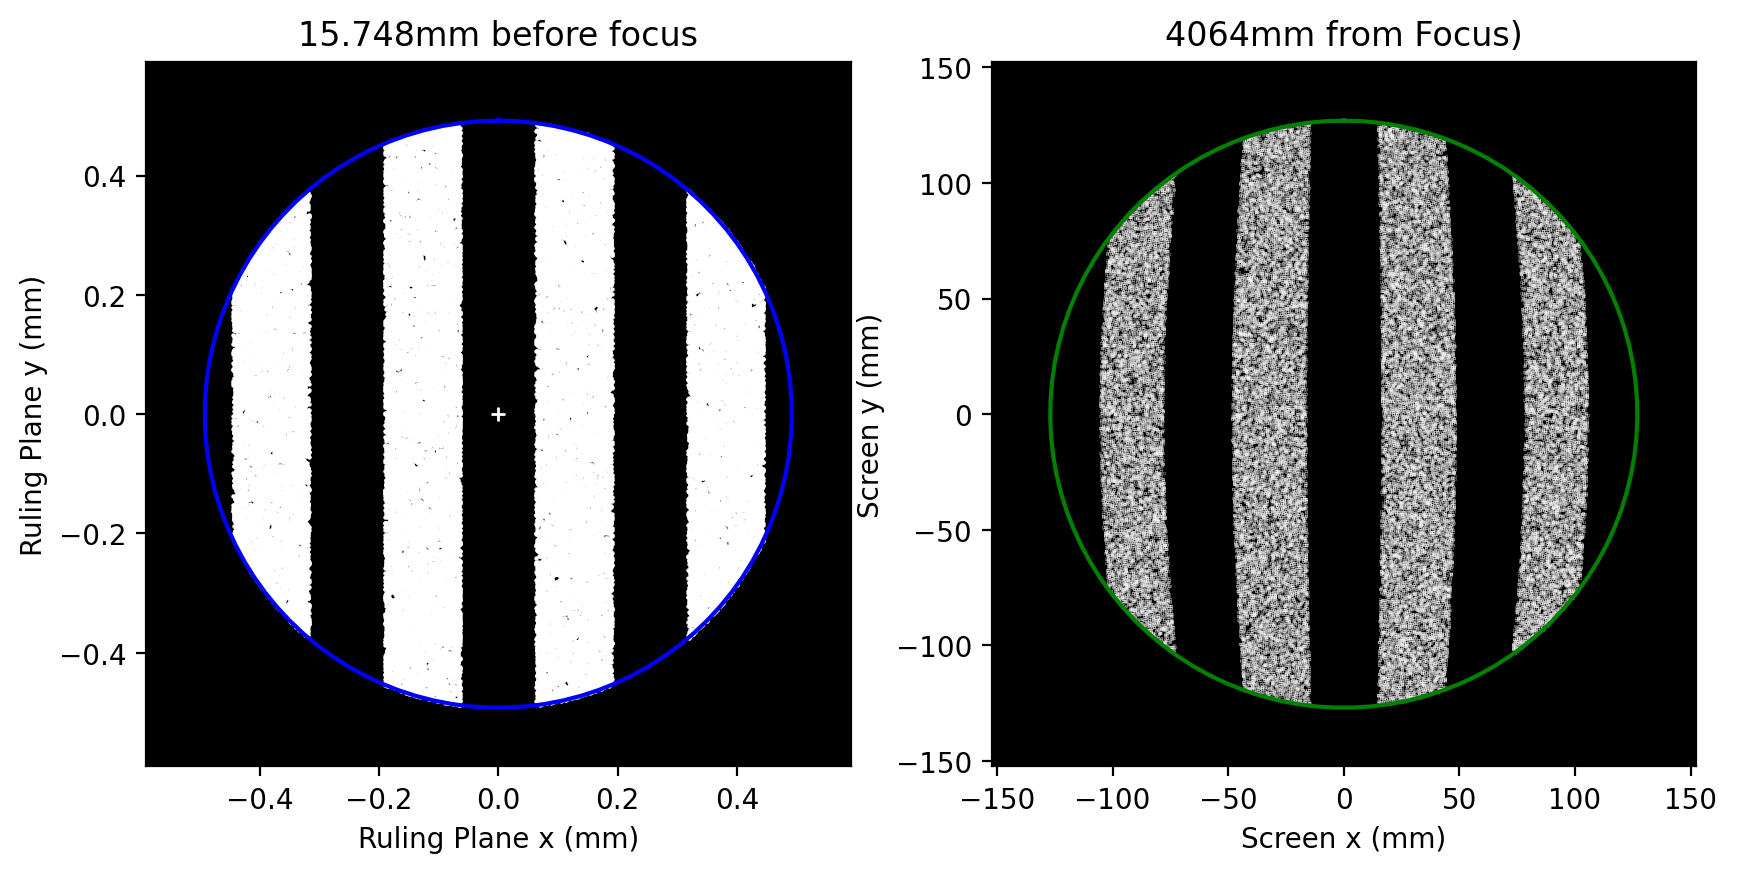
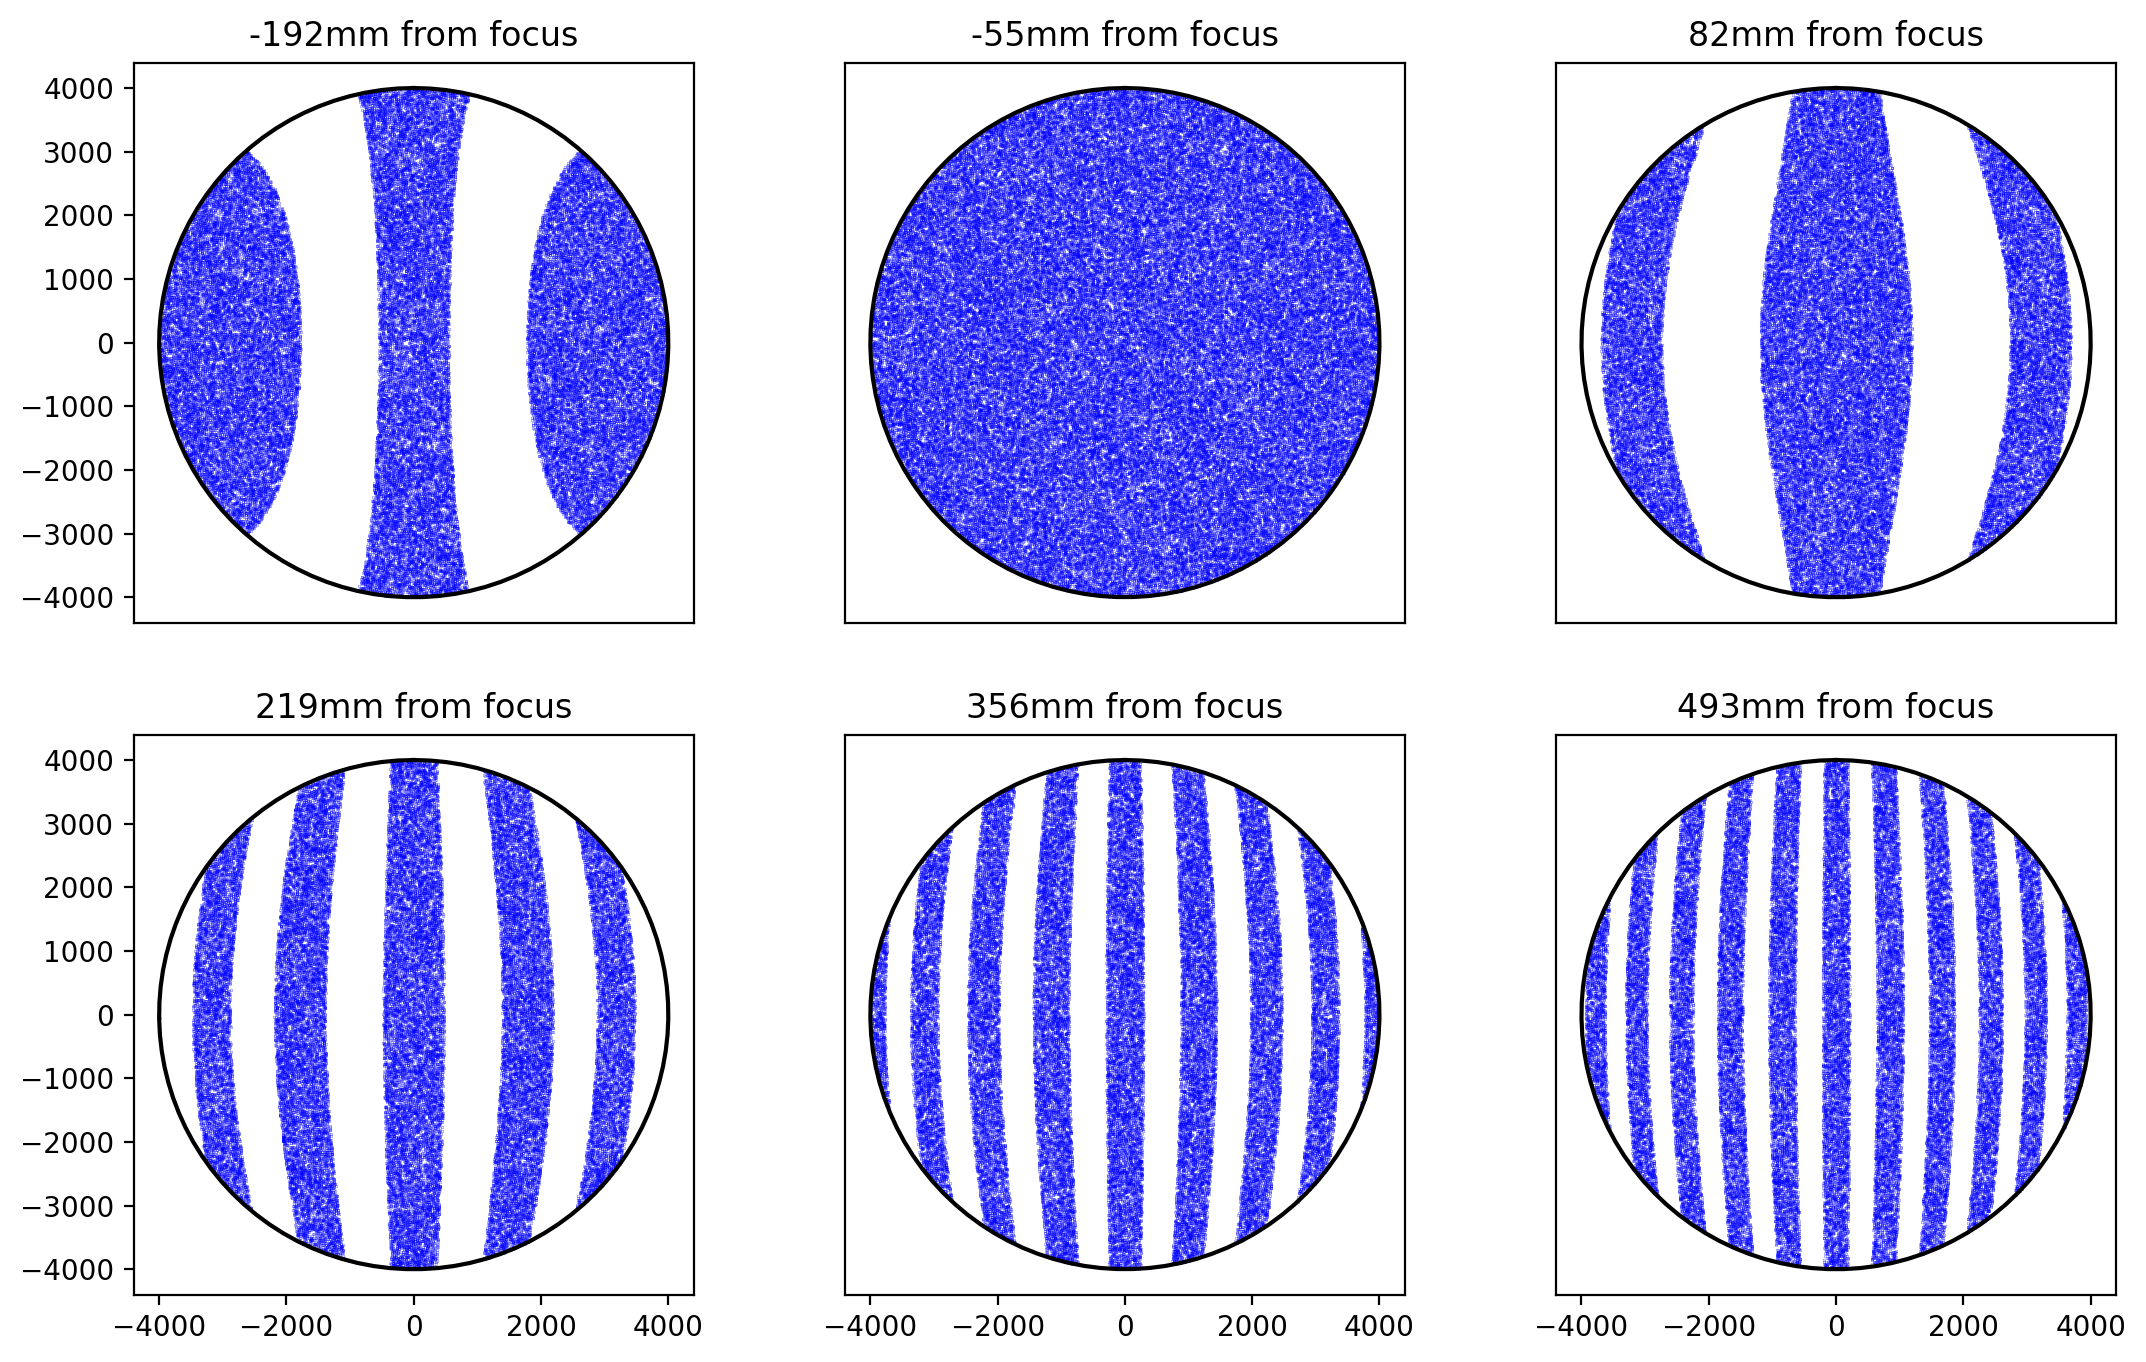
Here is what it should look like

[5]:
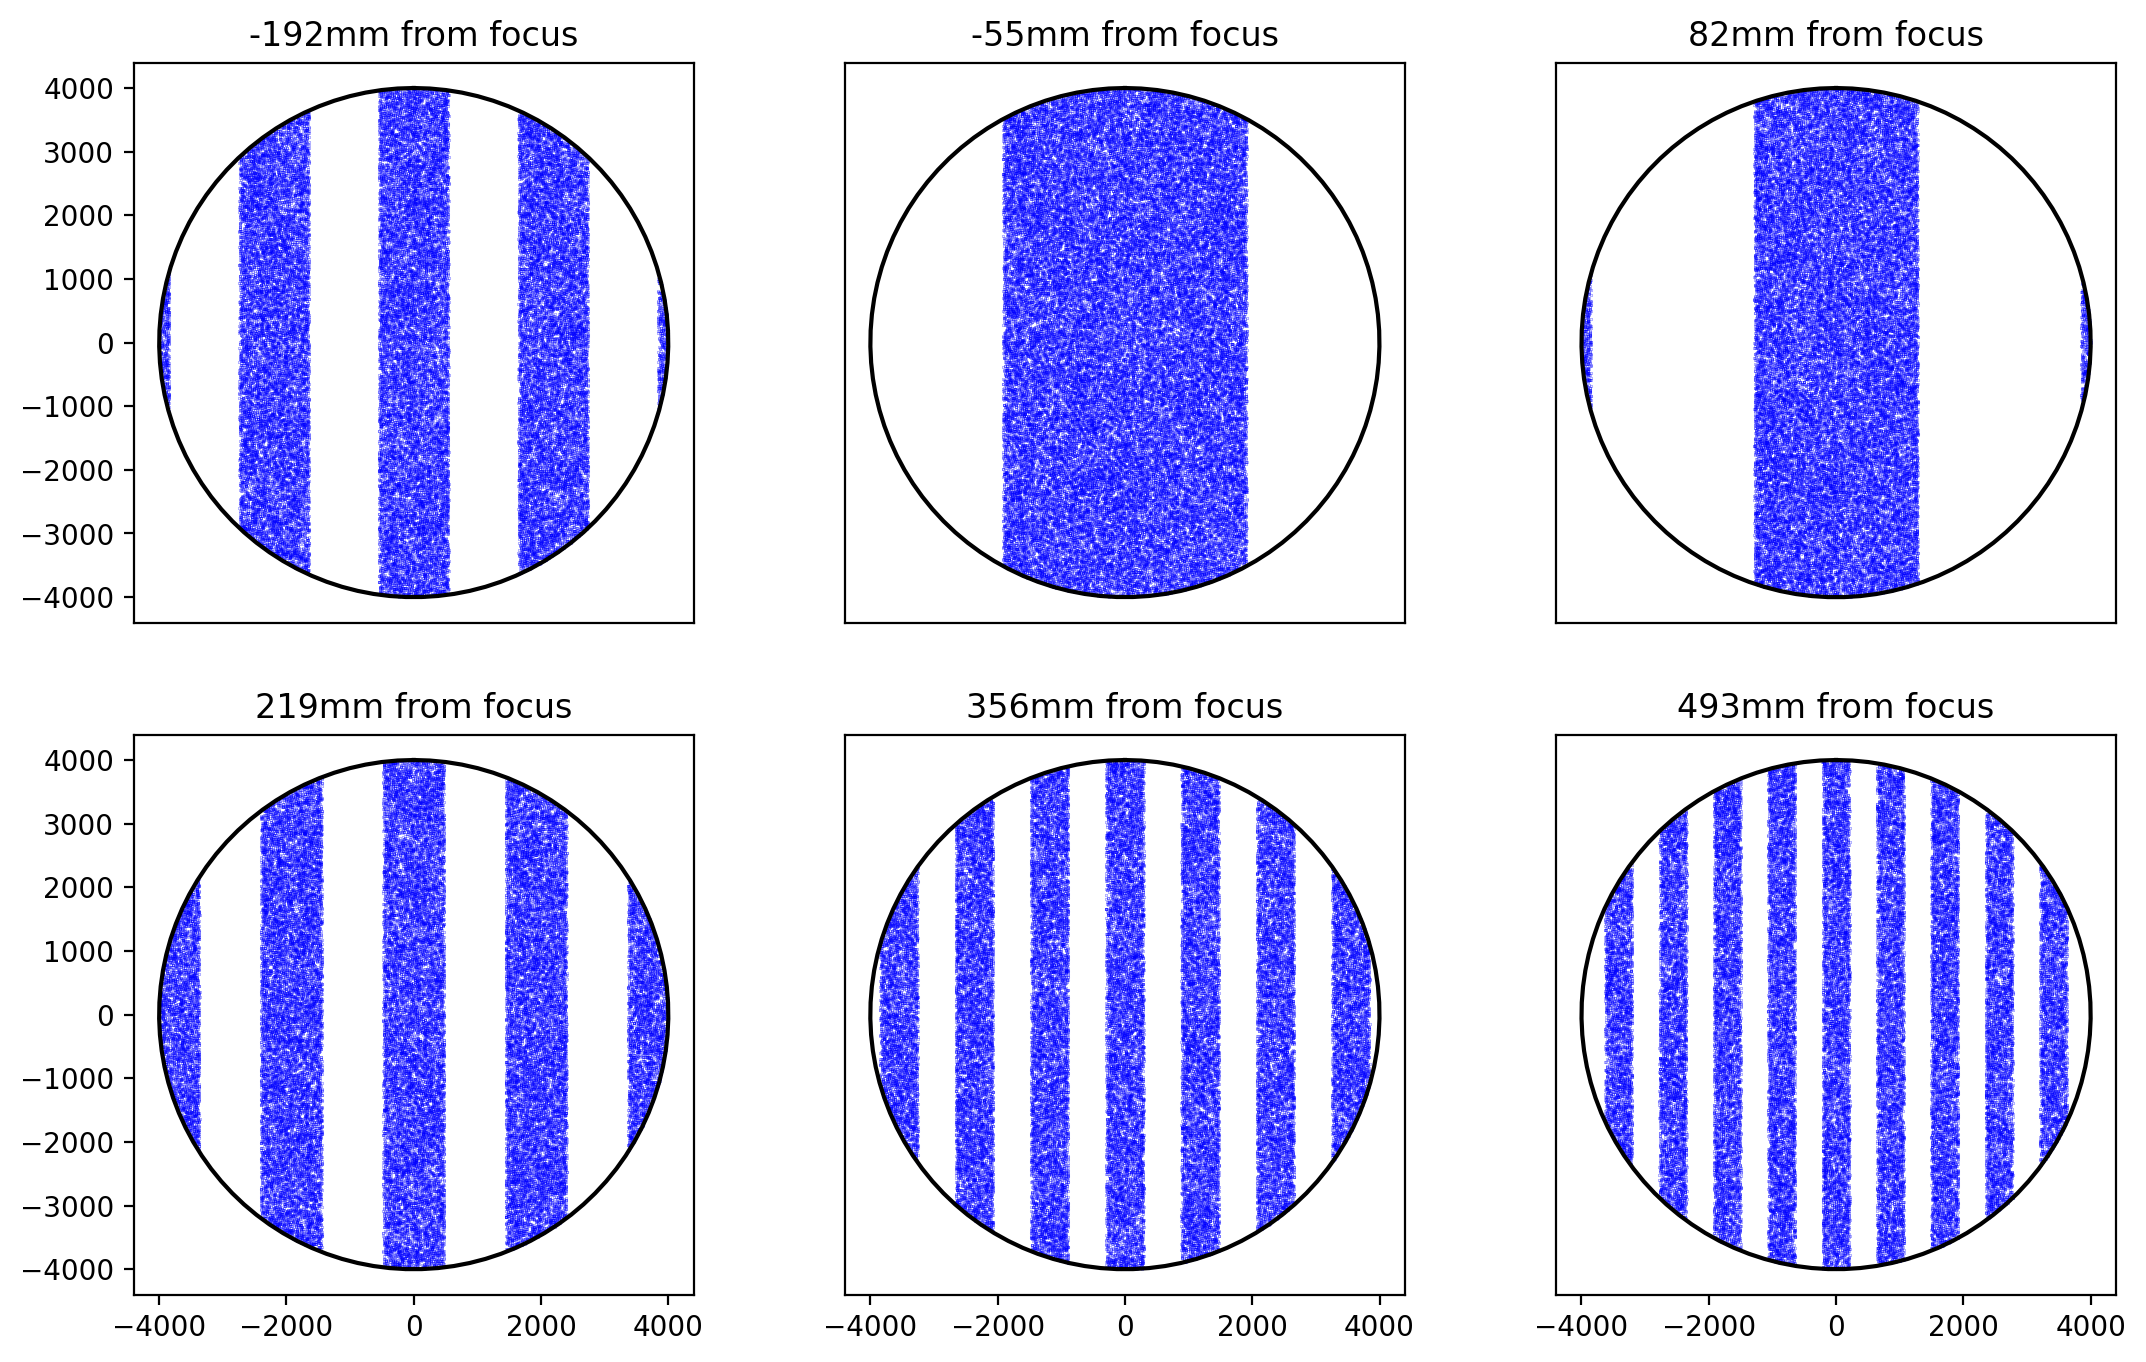
# spherical mirror

D = 8000  # 10 meter mirror
F_number = 7
conic = 0
lp_per_mm = 0.133  # grating frequency lp/mm

RoC = F_number * D * 2
f = RoC / 2

print("    Mirror Diameter = %.0f mm" % D)
print("                 F# = %.1f" % F_number)
print("Radius of Curvature = %.0f mm" % RoC)
print("       Focal Length = %.0f mm" % f)
print("   Ronchi Frequency = %.3f lp/mm" % lp_per_mm)

plt.subplots(2, 3, figsize=(13, 8))

for i, z_offset in enumerate([-192, -55, 82, 219, 356, 493]):
    plt.subplot(2, 3, i + 1)
    x, y = lenstest.ronchi.gram(D, RoC, lp_per_mm, z_offset, conic=conic, invert=True)
    plt.plot(x, y, "o", markersize=0.1, color="blue")
    #    for r in [0.37*D/2,0.7*D/2,0.93*D/2]:
    #        lenstest.lenstest.draw_circle(r, color='red')
    lenstest.lenstest.draw_circle(D / 2)
    plt.title("%.0fmm from focus" % z_offset)
    plt.gca().set_aspect("equal")
    if i in [1, 2, 4, 5]:
        plt.yticks([])
    if i in [0, 1, 2]:
        plt.xticks([])
plt.show()
    Mirror Diameter = 8000 mm
                 F# = 7.0
Radius of Curvature = 112000 mm
       Focal Length = 56000 mm
   Ronchi Frequency = 0.133 lp/mm
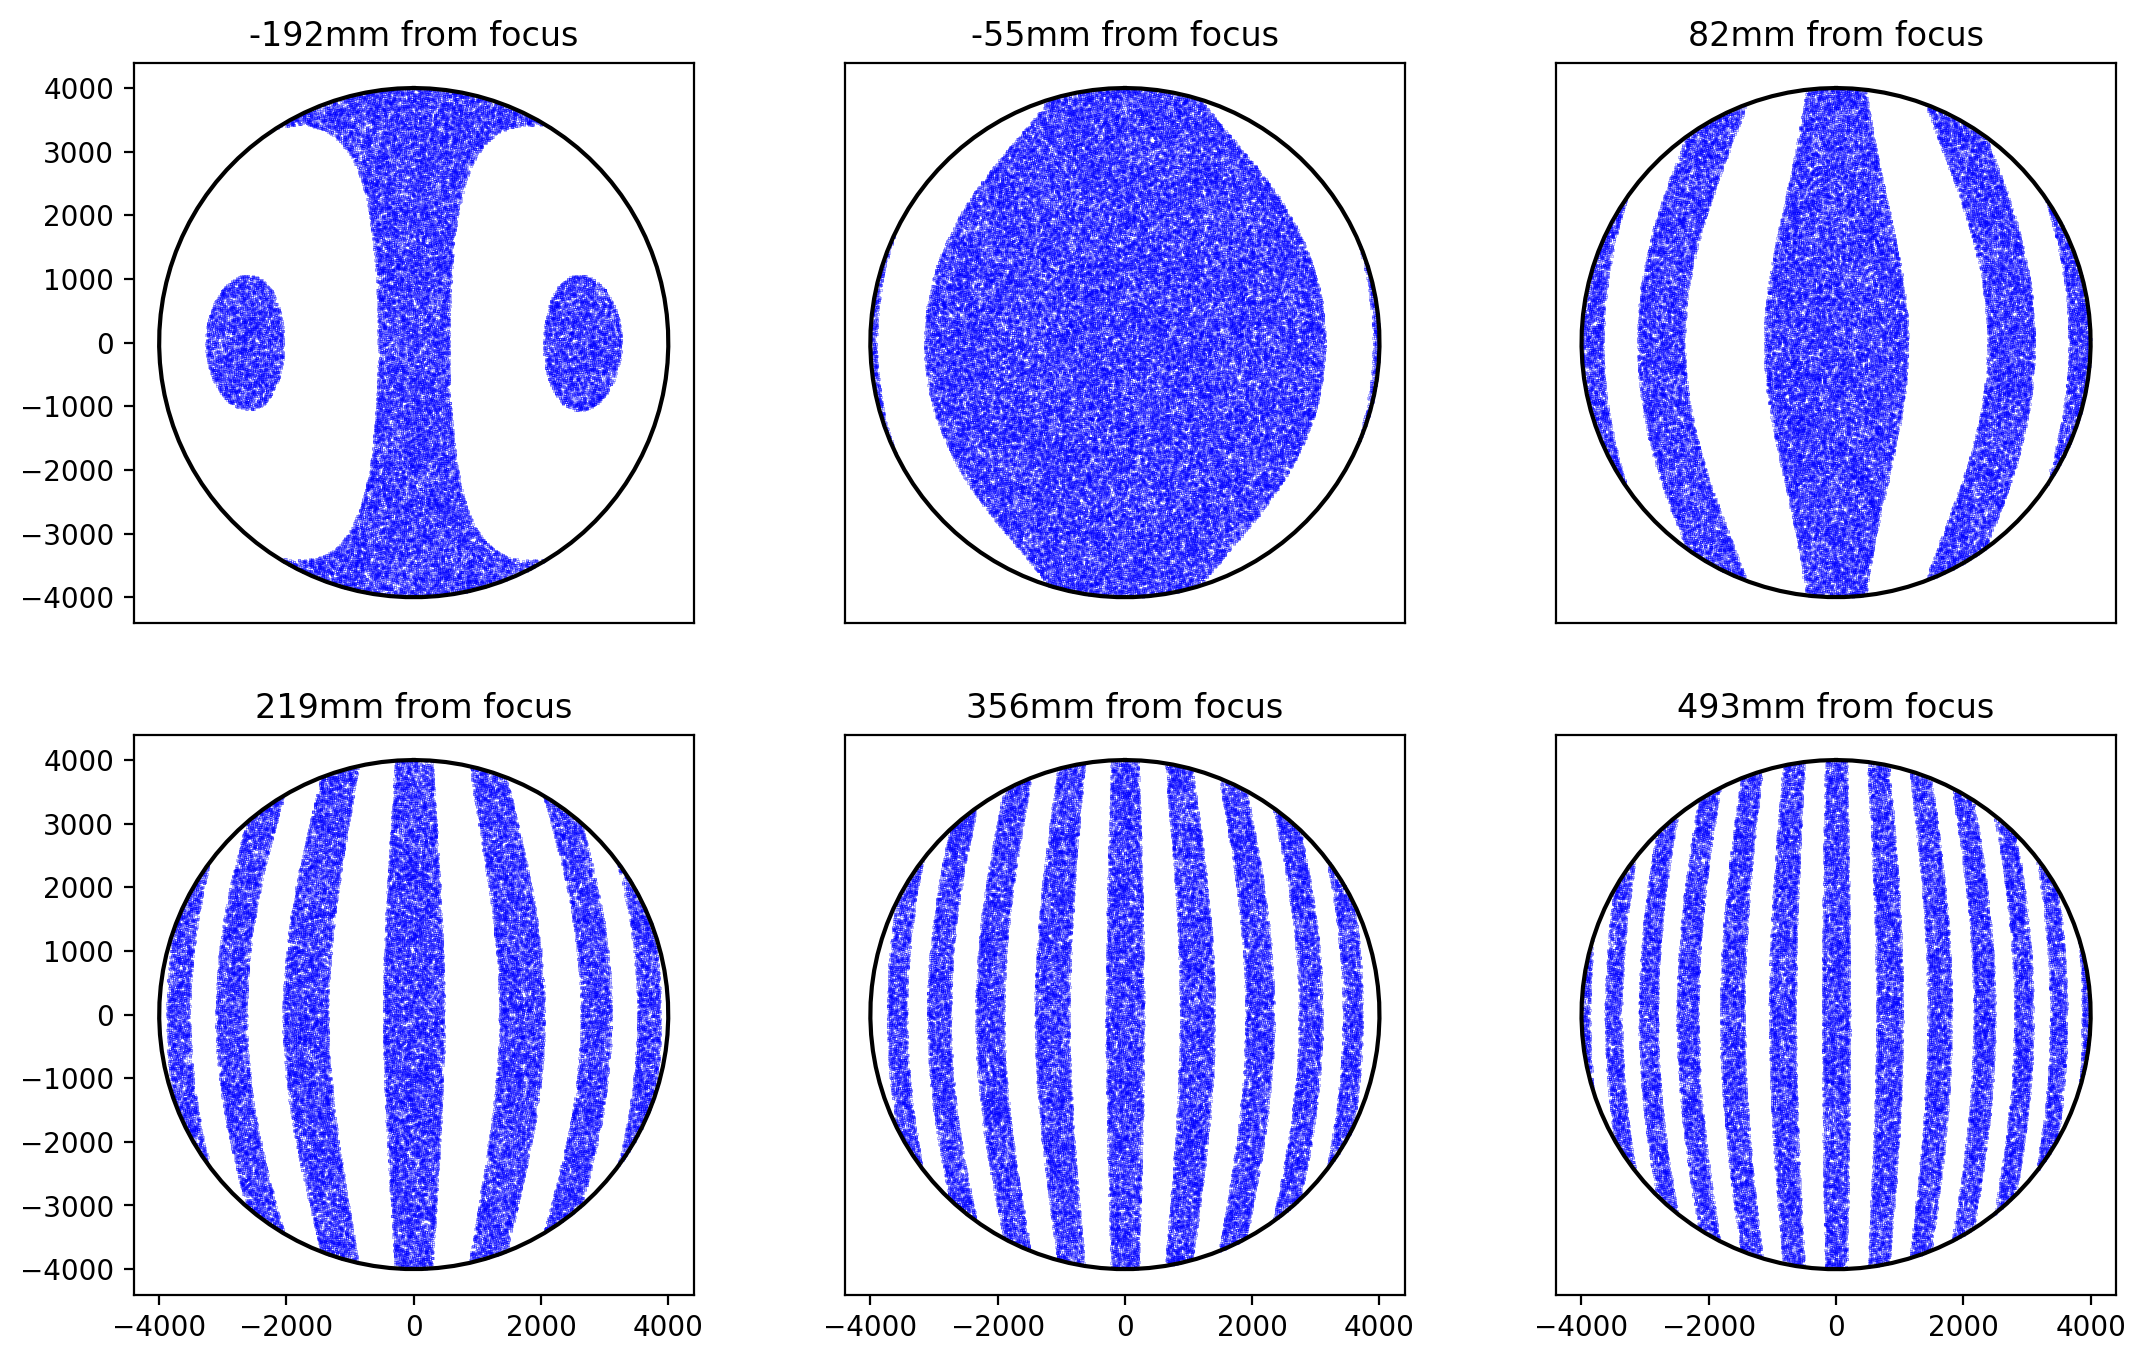
Oblate spheroid
[6]:
# oblate ellipsoid

D = 8000  # 8 meter mirror
F = 7
conic = 1
lp_per_mm = 0.133  # grating frequency lp/mm

RoC = F * D * 2

print("    Mirror Diameter = %.0f mm" % D)
print("                 F# = %.1f" % F)
print("Radius of Curvature = %.0f mm" % RoC)
print("       Focal Length = %.0f mm" % (RoC / 2))
print("   Ronchi Frequency = %.3f lp/mm" % lp_per_mm)

plt.subplots(2, 3, figsize=(13, 8))

for i, z_offset in enumerate([-192, -55, 82, 219, 356, 493]):
    plt.subplot(2, 3, i + 1)
    x, y = lenstest.ronchi.gram(D, RoC, lp_per_mm, z_offset, conic=conic, invert=True)
    plt.plot(x, y, "o", markersize=0.1, color="blue")
    #    for r in [0.37*D/2,0.7*D/2,0.93*D/2]:
    #        lenstest.lenstest.draw_circle(r, color='red')
    lenstest.lenstest.draw_circle(D / 2)
    plt.title("%.0fmm from focus" % z_offset)
    plt.gca().set_aspect("equal")
    if i in [1, 2, 4, 5]:
        plt.yticks([])
    if i in [0, 1, 2]:
        plt.xticks([])
plt.show()
    Mirror Diameter = 8000 mm
                 F# = 7.0
Radius of Curvature = 112000 mm
       Focal Length = 56000 mm
   Ronchi Frequency = 0.133 lp/mm
Hyperboloidal mirror
[7]:
D = 8000  # 8 meter mirror
F = 7
conic = 2
lp_per_mm = 0.133  # grating frequency lp/mm

RoC = F * D * 2

print("    Mirror Diameter = %.0f mm" % D)
print("                 F# = %.1f" % F)
print("Radius of Curvature = %.0f mm" % RoC)
print("       Focal Length = %.0f mm" % (RoC / 2))
print("   Ronchi Frequency = %.3f lp/mm" % lp_per_mm)

plt.subplots(2, 3, figsize=(13, 8))

for i, z_offset in enumerate([-192, -55, 82, 219, 356, 493]):
    plt.subplot(2, 3, i + 1)
    x, y = lenstest.ronchi.gram(D, RoC, lp_per_mm, z_offset, conic=conic, invert=True)
    plt.plot(x, y, "o", markersize=0.1, color="blue")
    #    for r in [0.37*D/2,0.7*D/2,0.93*D/2]:
    #        lenstest.lenstest.draw_circle(r, color='red')
    lenstest.lenstest.draw_circle(D / 2)
    plt.title("%.0fmm from focus" % z_offset)
    plt.gca().set_aspect("equal")
    if i in [1, 2, 4, 5]:
        plt.yticks([])
    if i in [0, 1, 2]:
        plt.xticks([])
plt.show()
    Mirror Diameter = 8000 mm
                 F# = 7.0
Radius of Curvature = 112000 mm
       Focal Length = 56000 mm
   Ronchi Frequency = 0.133 lp/mm
10 meter parabolic mirror comparison
Ronchigrams passing through focus
Here are six ronchigrams at different locations inside and outside the focus.
[8]:
D = 10000  # 10 meter mirror
F = 5
conic = -1
lp_per_mm = 0.133  # grating frequency lp/mm

RoC = F * D * 2

print("    Mirror Diameter = %.0f mm" % D)
print("                 F# = %.1f" % F)
print("Radius of Curvature = %.0f mm" % RoC)
print("       Focal Length = %.0f mm" % (RoC / 2))
print("   Ronchi Frequency = %.3f lp/mm" % lp_per_mm)

plt.subplots(2, 3, figsize=(13, 8))

for i, z_offset in enumerate([-63, 35, 133, 231, 329, 429]):
    plt.subplot(2, 3, i + 1)
    x, y = lenstest.ronchi.gram(D, RoC, lp_per_mm, z_offset, conic=conic)
    plt.plot(x, y, "o", markersize=0.1, color="blue")
    #    for r in [0.37*D/2,0.7*D/2,0.93*D/2]:
    #        lenstest.lenstest.draw_circle(r, color='red')
    lenstest.lenstest.draw_circle(D / 2)
    plt.title("%.0fmm from focus" % z_offset)
    plt.gca().set_aspect("equal")
    if i in [1, 2, 4, 5]:
        plt.yticks([])
    if i in [0, 1, 2]:
        plt.xticks([])
plt.show()
    Mirror Diameter = 10000 mm
                 F# = 5.0
Radius of Curvature = 100000 mm
       Focal Length = 50000 mm
   Ronchi Frequency = 0.133 lp/mm
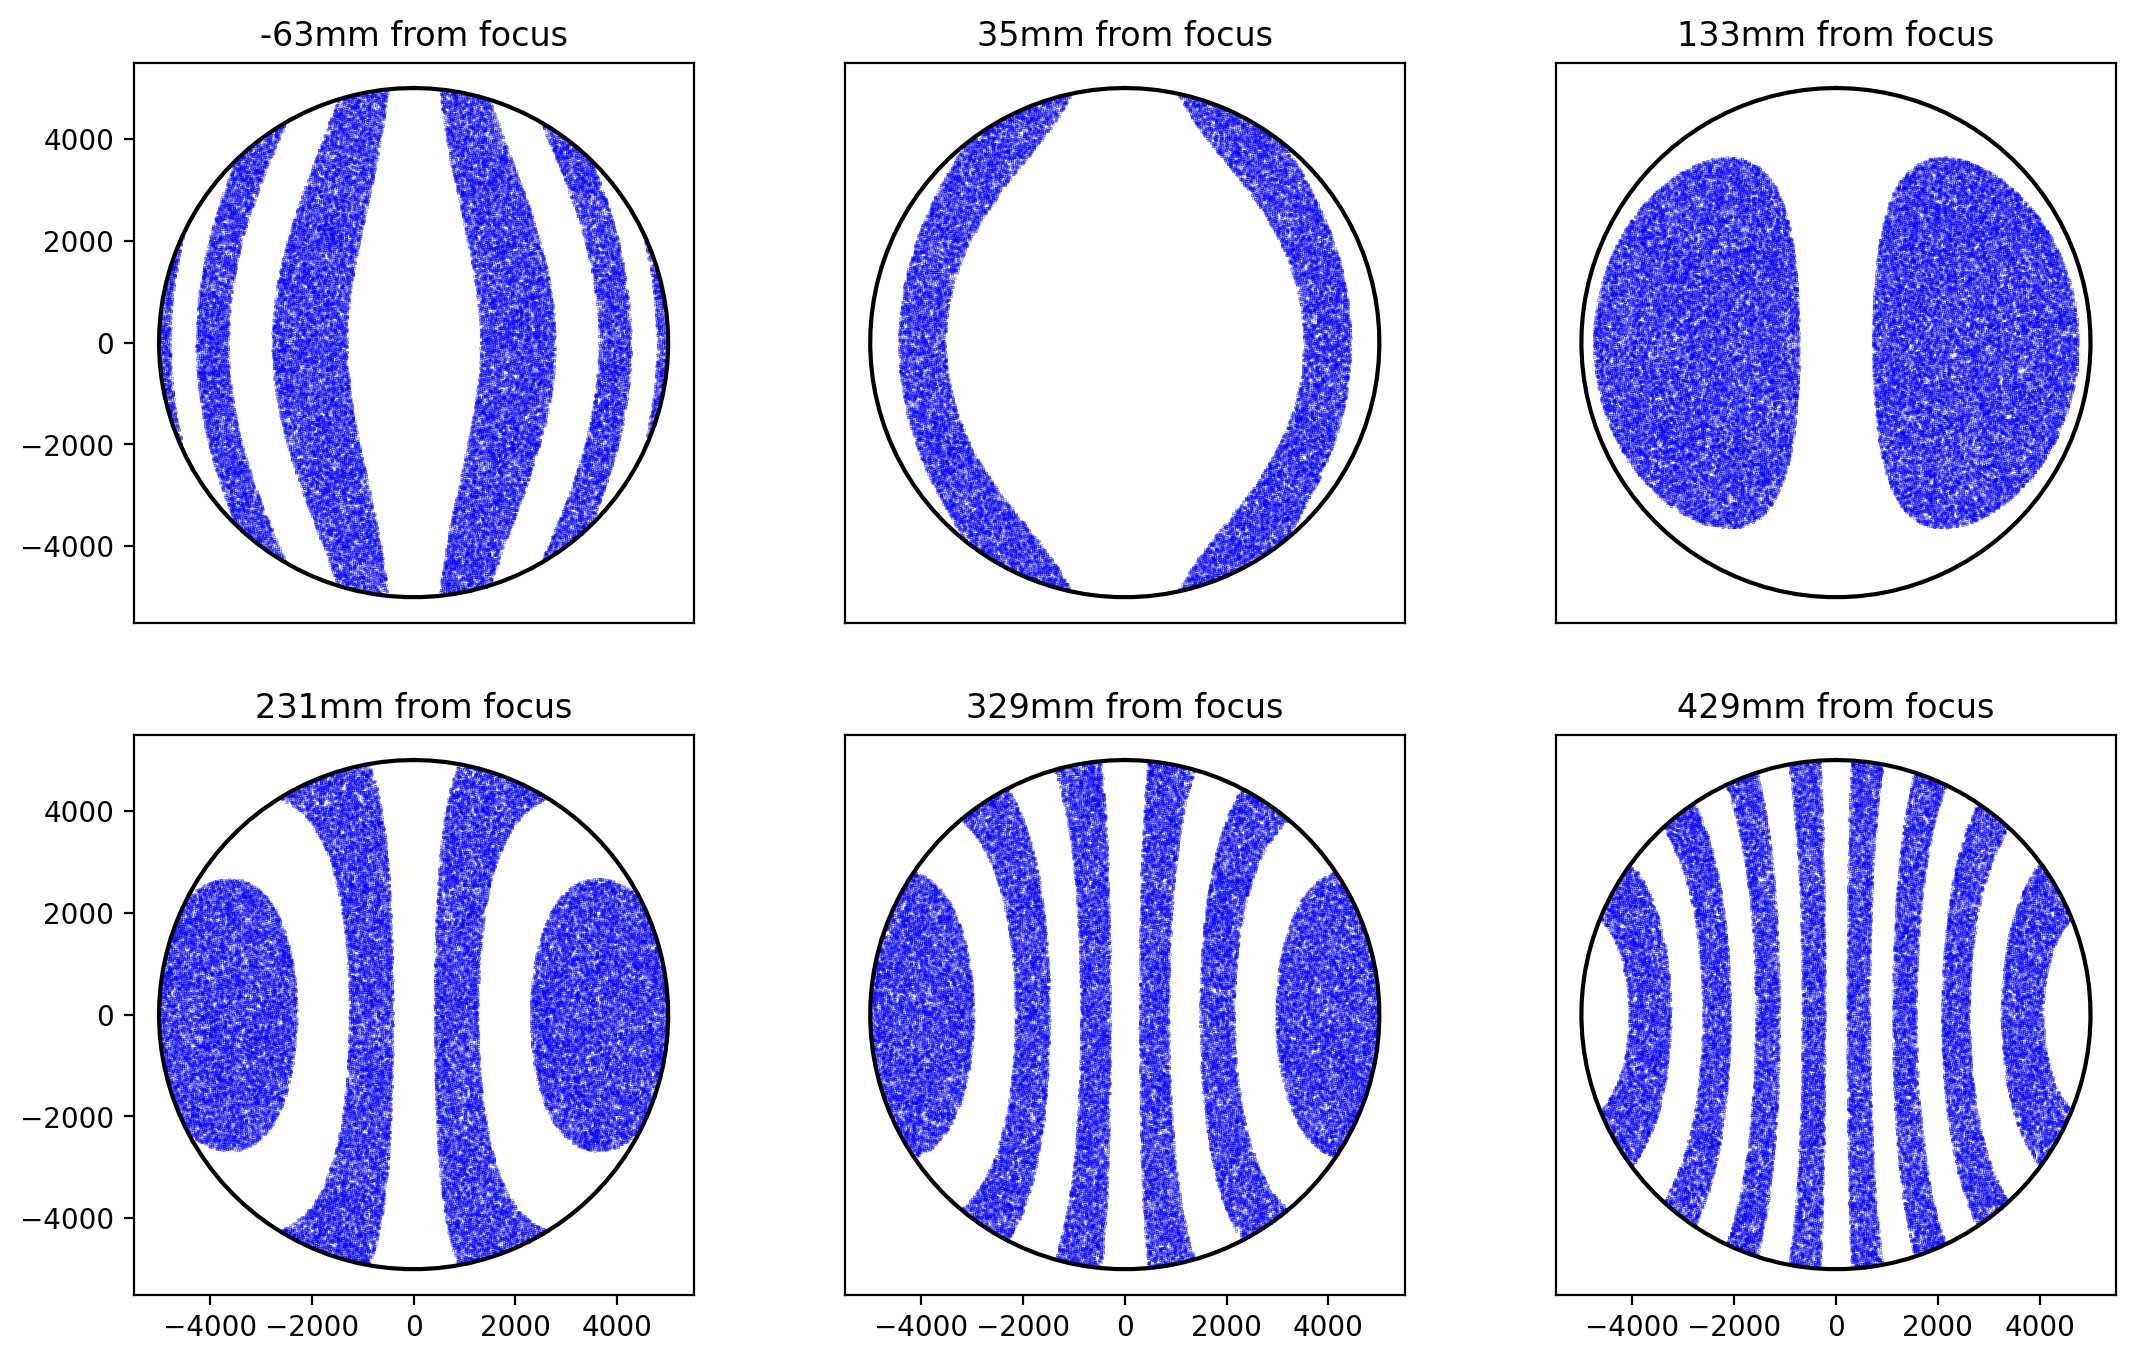
We an compare this to figure 2 from Upton’s page on simulating the Ronchi test
[ ]: